
Figure 4.
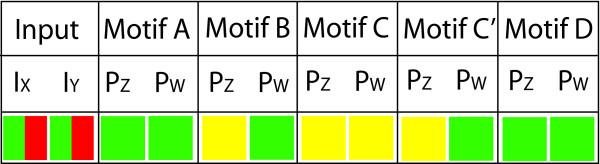
This table shows the variation in the outputs of the different motifs when both inputs are turned on to a high level for 3600 seconds and then abruptly turned off. This is denoted in the inputs as green then red. The outputs are then categorised and colour coded as either off, low or high, corresponding to red, yellow or green. This scenario corresponds to relatively short term exposure to a transcription factor up the transcription network. Again, the details of the model can be found in the methods section, and the parameters used are given in Table 2