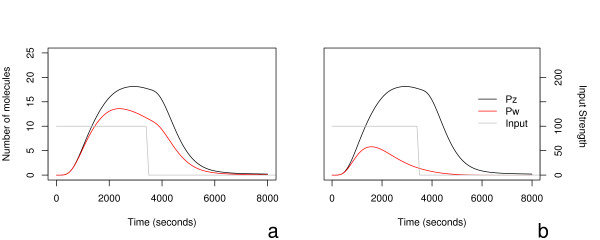
Figure 8.

We see the effect of assuming that the production rate of PW is sensitive to the order of binding of PX and PY to the DNA of gene Z, see text for details. As before, the y-axes are shared. The two expression profiles for PW correspond to inverting the inputs, showing that the motif may able to differentiate between signal combinations. IX and IY are again modelled as step functions which switch to 0 after 3600 seconds.
