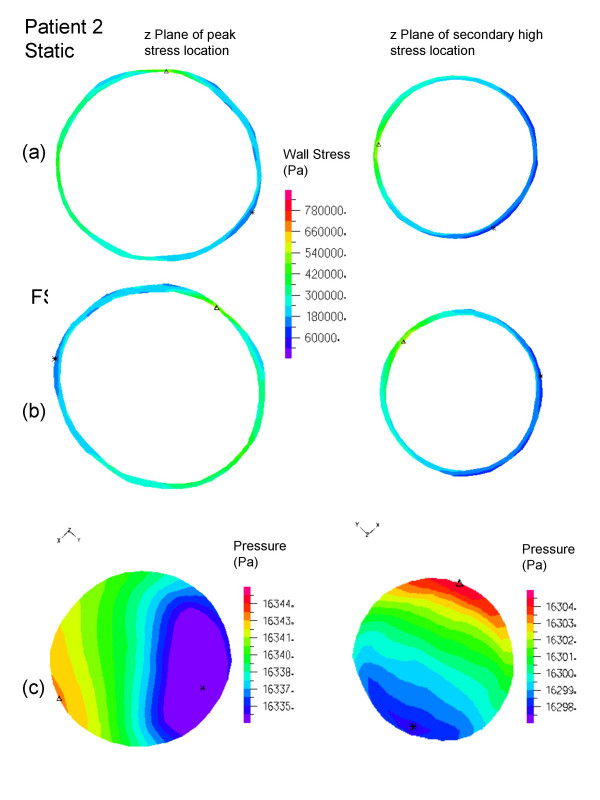
Figure 7.
Patient 2, wall stress and fluid pressure in the z-plane at the location of peak stress (left) and high stress (right) of the AAA. The inner wall stress of static (top) and FSI (center) are shown with the complementing velocity magnitude (below). The triangles (Δ) indicate maximum stress of that z plane.

