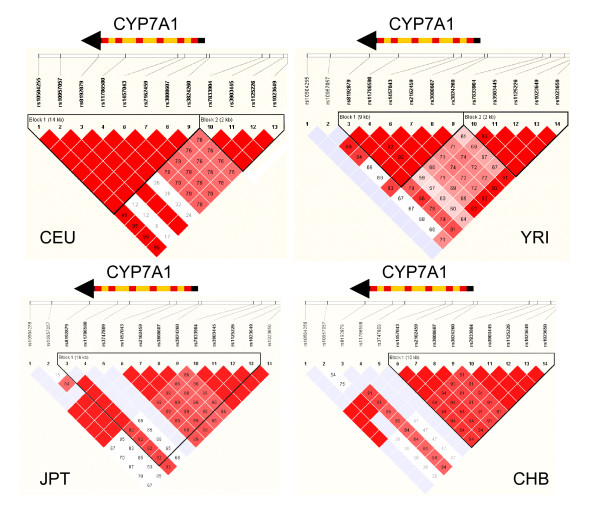
Figure 1.
Linkage disequilibrium of the SNP markers in the CYP7A1 gene in the HapMap populations of CEU, CHB, JPT and YRI. A standard color scheme is used to display LD with bright red color for very strong LD (LOD = 2 D' = 1), white color for no LD (LOD<2, D'<1), pink red (LOD = 2 D'<1), and blue (LOD<2 D' = 1) for intermediate LD.

