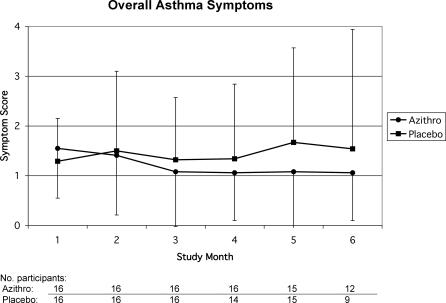
Figure 2. Overall Asthma Symptoms in the Azithromycin and Placebo Groups.
Months 1 and 2: Baseline and treatment period. Month 3: Completion of treatment. Months 4–6: Posttreatment. Numbers of participants included in each data point are indicated under the x-axis. Error bars represent 95% confidence intervals for individual data points. Linear regression analysis showed a significant (p = 0.04) overall difference between azithromycin and placebo group patterns.

