Figure 5.
Superimposition of ACT Domains.
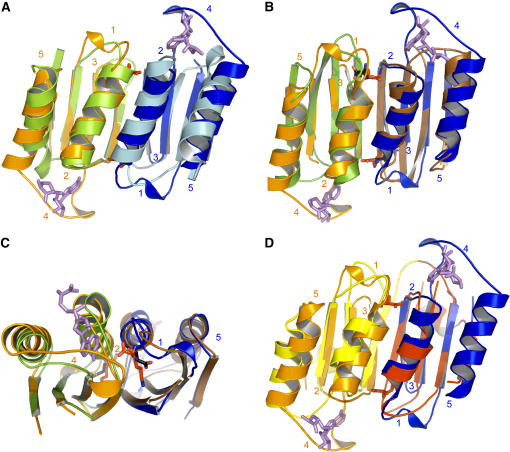
(A) Superimposition of ACT1 domains of monomer A (ACT1A; orange) and B (ACT1B; blue) with ACT2 domains of monomer A (light green) and B (light blue) of AK1. The figure shows that ACT2 domains are unable to bind Lys and SAM molecules.
(B) Superimposition of ACT1A (orange) and ACT1B (blue) of AK1 with ACT domains of PGDH (monomers A and B of PGDH are colored in green and brown, respectively). The figure shows that Lys and Ser binding sites are located at the same place.
(C) A 90° rotated view, with respect to the horizontal axis, showing a zoom on the Ser (black sticks) and Lys (red sticks) molecules depicted in (B).
(D) Superimposition of ACT1A (orange) and ACT1B (blue) of AK1 with ACT domains of one monomer of TD (ACT1 and ACT2 of one monomer of TD are colored in yellow and red, respectively). In the case of TD, two different ACT domains interact, generating two nonequivalent binding sites. Lys and SAM molecules are depicted as red and violet sticks, respectively.

