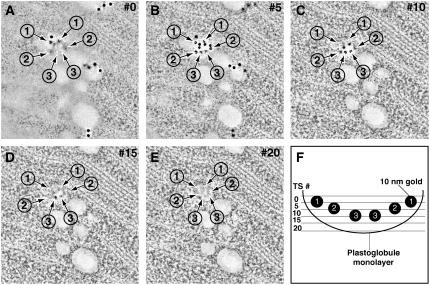
Figure 7.
Anti-VTE1 Serial Immunoelectron Tomography.
(A) to (E) Serial 2.2-nm tomographic slice images (every fifth slice shown) through a plastoglobule labeled with anti-VTE1. Note that as one proceeds from the top of the section (A) to the bottom (E), different groups of 10-nm gold labels, indicated by arrows and numbers, are seen at different depths within the plastoglobule interior.
(F) Cartoon representation of the plastoglobule, as shown in (A) to (E), with all of the gold labels (the numbers correspond to the numbers assigned to the gold labels in [A] to [E]) and their respective positions in each tomographic slice (TS).

