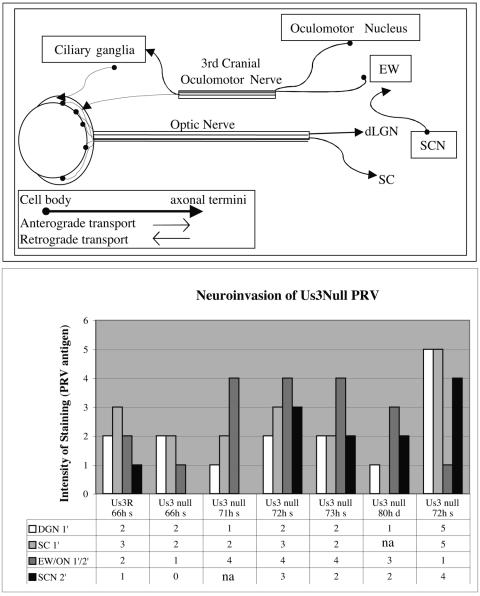
FIG. 10.
PRV neuroinvasion of the CNS. (Top) Schematic diagram of some of the neural circuitry associated with the eye. (Bottom) Animals were perfused at the time of death (d) or sacrifice (s). The hours postinfection are indicated. Brain sections were ranked according to increasing levels of PRV antigen (range, 1 [low] to 5 [high]) by visual inspection. Spread of PRV 813R (Us3R) and PRV 813 (Us3 null) to primary (1′) and secondary (2′) synaptically connected neurons in the anterograde and retrograde visual circuits can be seen both numerically and visually in the bar graph.

