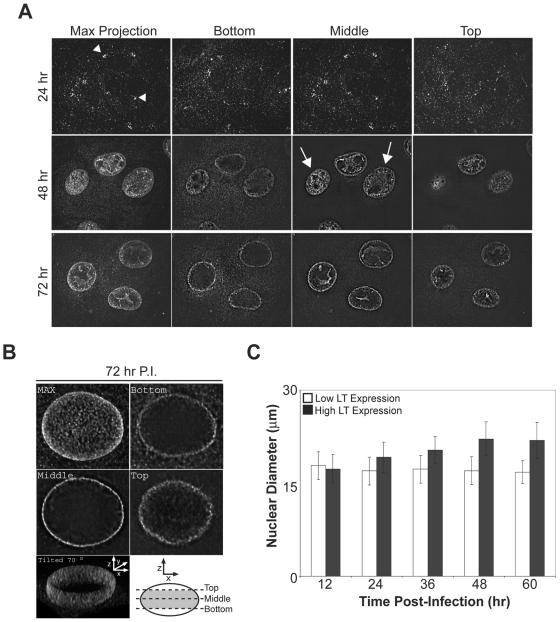
FIG. 4.
SV40 egresses to the nuclear envelope after the expansion of the nucleus due to the accumulation of progeny virions. (A) Representative fluorescent images of SV40-infected BS-C-1 cells, fixed at the indicated times postinfection, immunostained for VP1, and examined by confocal microscopy. Serial z sections were compiled to produce the “Max Projection” while individual z sections from the bottom, middle, and top of the cells are displayed for samples at 48 and 72 h postinfection. The arrowheads indicate the perinuclear accumulation of incoming SV40 and the arrows designate cells with newly synthesized VP1 throughout the nucleus. (B) z sections of an infected cell at 72 h postinfection were collected, deconvolved, and reconstructed into a three-dimensional volume. The compilation of the z sections is shown in “MAX” and single z sections taken according to the diagram from the bottom, middle, and top of the cell are displayed. The two-dimensional projection of the reconstructed three-dimensional volume of the diagrammed section (gray area) was tilted 70° to display the inside of the nucleus. P.I., postinfection. (C) The nuclear diameter of SV40-infected BS-C-1 cells over time with high and low LT expression. Confluent BS-C-1 coverslips were infected as in Fig. 1A, fixed at the indicated time, and immunostained for LT to identify infected cells.

