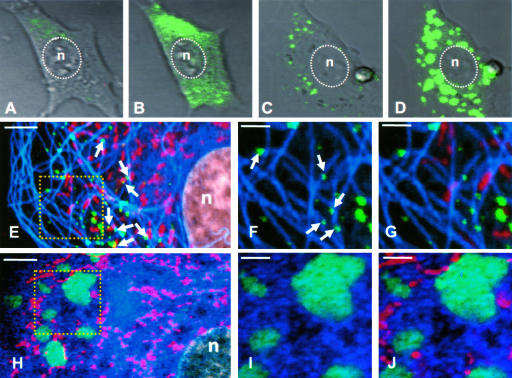
FIG. 7.
Imaging of VSV-PeGFP-infected cells to demonstrate the effect on NOC on nucleocapsid transport. (A to D) DIC images of live cells showing fluorescent nucleocapsid synthesis in infected cells at 2 (A and C) or 4 (B and D) hpi without (A and B) or with (C and D) NOC treatment. The nucleus (n) is marked by a dotted oval. (E to G) Untreated cells infected with VSV-PeGFP were stained with MitoTracker Red at 4 hpi, fixed, and immunostained with antitubulin antibody. VSV nucleocapsids (green), mitochondria (red), and MTs (pseudocolor blue) were visualized by confocal fluorescence microscopy. The area in the square in panel E is magnified in panels F and G. Arrows in panel E show some nucleocapsids in association with mitochondria. Arrows in panel F show some nucleocapsids directly on MT tracks. (H to J) Same as in panels E to G, but with NOC treatment. The area in the square in panel H is magnified in panels I and J. Bars, 5 μm (E and H) and 2 μm (F, G, I, and J).

