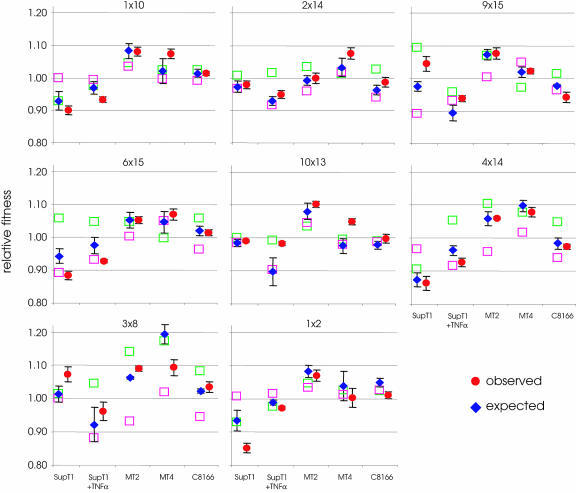
FIG. 5.
The relative fitness of a virus with two nucleotide substitutions corresponds well to an additive model. The fitness values of the single-mutant virus are indicated as green and purple squares, and their identity is shown above the graphs (see Fig. 1 and Table 1 for mutation numbers). Bars on circles represent standard errors. The five cellular environments in which relative fitness was measured are indicated below the graphs.

