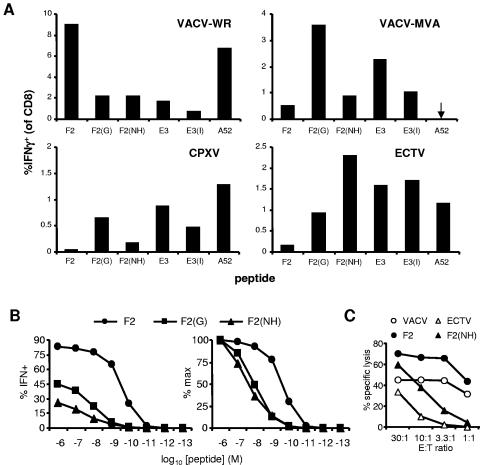
FIG. 3.
Cross-reactivity between TCD8+ elicited by VACV-WR and variant peptides from other orthopoxviruses. In all panels, VACV-WR peptides are indicated by protein name; variants are F2(G) (SPGAAGYDL), F2(NH) (SNHAAGYDL), and E3(I) (VGPSNSPIF). (A) Mice were infected with the orthopoxvirus shown in the top left of each graph: VACV-WR and MVA, 106 and 108 PFU, respectively, i.p.; CPXV, 105 PFU i.p.; and ECTV-TK−, 2 × 10⁷ PFU s.c. in the rear leg shank. Splenic TCD8+ responses to peptides were measured by ICS after 7 days (VACV strains) and 8 days (CPXV and ECTV). Data are percentages of TCD8+ that produce IFN-γ in ex vivo stimulations with peptides. Means and standard errors of the means for groups of four or five mice are plotted and are representative of repeated experiments. (B and C) A TCD8+ line was derived from VACV-WR immune splenocytes by five restimulations with SPYAAGYDL in vitro and tested for cross-reactivity with variant peptides at various concentrations by ICS (B) and to peptides and virus-infected cells by cytotoxicity assay (C). (B, left) Percent TCD8+ that produce IFN-γ after a short stimulation with the peptide shown (circle, SPYAAGYDL; square, SPGAAGYDL; triangle, SNHAAGYDL); (B, right) the same data presented as percentages of the maximum response. Panel C shows percent specific lysis at the E:T ratios indicated for this TCD8+ line against ECTV-infected (ECTV, unfilled triangle) or VACV-WR-infected (VACV, unfilled circle) P815 cells or peptide-pulsed P815 as indicated above the graph (symbols as in panel B).

