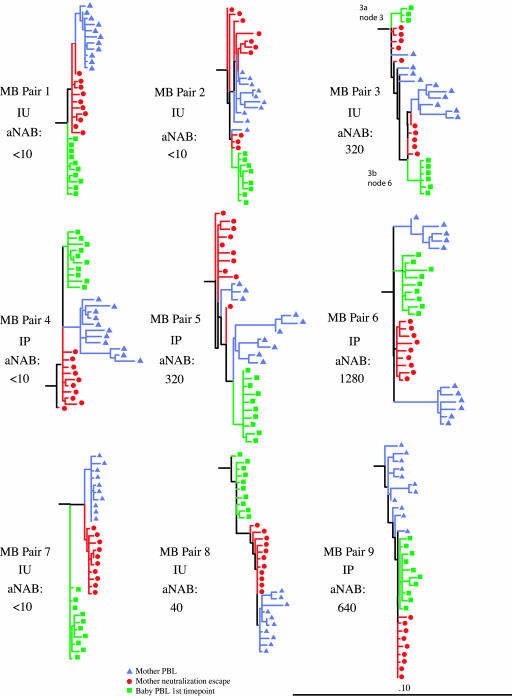
FIG. 4.
Maximum likelihood trees. Nucleotide sequences from maternal time-of-delivery PBMC (blue), maternal time-of-delivery aNAB culture cells (red), and infant first-positive-time-point PBMC (green). Horizontal branch lengths are drawn to scale, with the black bar representing 10% divergence. IU, in utero; IP, intrapartum.

