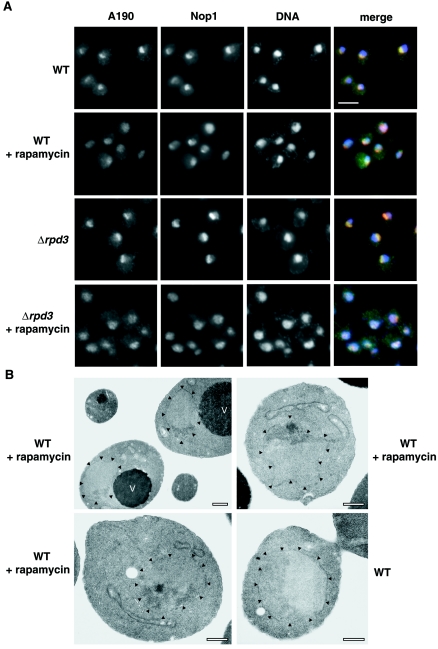
FIG. 5.
IFM analysis of nucleolar structures in WT and rpd3Δ strains and EM analysis of WT strain treated with rapamycin. (A) Double-label indirect IFM of WT and rpd3Δ strains. Images of WT (NOY388) cells and rpd3Δ (NOY2015) cells are shown. Cells growing exponentially in YEPD complete medium at 30°C were treated with rapamycin (0.2 μg/ml for 1 h) and compared to control cells without rapamycin treatment. Images across each row represent the same field of cells. The first two images in the row depict the localization of two nucleolar proteins, A190 and Nop1, using anti-A190 and anti-Nop1 antibodies, respectively. The third image shows DNA stained with 4′,6′-diamidino-2-phenylindole (DAPI). The first three images are merged in the last panel with A190 in green, Nop1 in red, and DNA in blue. Bar, 5 μm. (B) EM analysis of WT cells grown as described above for panel A with or without rapamycin. The top left image represents the most common nucleolar morphology after treatment with rapamycin. The top right and bottom left images are representative of ∼9% of nucleolar cross sections observed in the EM. The bottom right panel is a WT cell without rapamycin treatment. Arrowheads point to the nuclear envelope. Vacuoles(V) are indicated. Bars, 0.5 μm.

