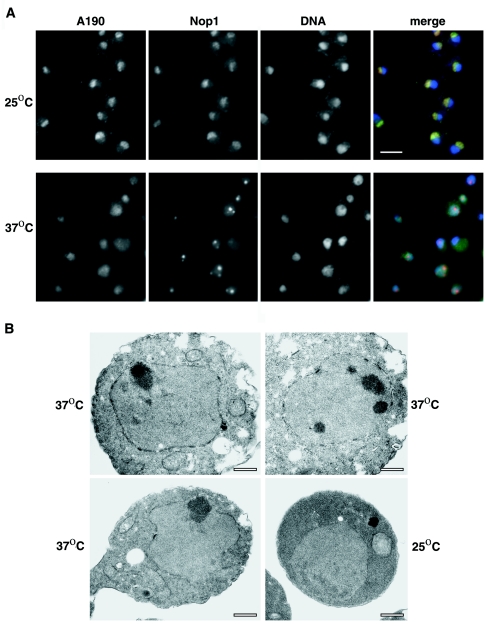
FIG. 7.
IFM and EM analyses of nucleolar structures in an rrn3 TS strain grown at a permissive temperature and after a shift to the nonpermissive temperature. (A) Double-label indirect IFM of rrn3 TS strain NOY1075. Mutant TS cells grown at 25°C in YEPD complete medium are shown in the top row; cells in the bottom row are shown after temperature shift to 37°C for 3 h. Images across each row are from the same field of cells. In the first three images, the localization of A190, Nop1, and DNA is observed, respectively, as described in the legend to Fig. 5A. The last image in each row is a merged image as in Fig. 5. Bar, 5 μm. (B) EM analysis of the same rrn3 TS strain grown at 25°C (bottom right image) and after temperature shift to 37°C for 3 h (remaining images). Bars, 0.5 μm.

