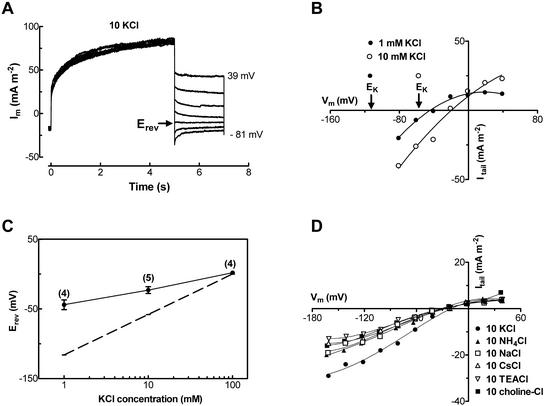
Figure 3.
Selectivity of slowly activating outward current determined by tail-current measurement. A, The current was activated by stepping the voltage from holding potential of −41 to 79 mV and then stepping down to the potentials from 39 to −81 mV. Bath solution was: 10 mm KCl, 1 mm CaCl2 and type I pipette solution. B, Tail-current-voltage curves of a protoplast in 10 mm and 1 mm KCl solutions. ECl was 54 and 89 mV in 10 mm and 1 mm KCl solutions, respectively. C, Erev plotted as a function of external concentrations of K+. The data were means of protoplasts measured (the number of protoplasts is given in bracket for each point; error bars are the se). The dashed line represents equilibrium potential for K+ (EK). D, Tail current, taken as the difference between the amplitude of the tail current immediately after the decay of the capacitance current and the steady current, plotted against voltages of one protoplast in 10 mm cation solutions.

