Figure 9.
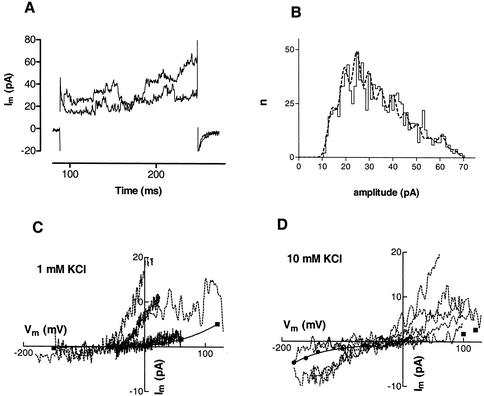
Analysis of fast-activating channel currents in outside-out patches. A, Two separate current responses as a function of time illustrating rapid activation of channels subjected to voltage clamp pulses to 120 mV from a holding potential of −100 mV. B, Amplitude histogram (solid line) generated by transition/amplitude (TRAMP) on data such as that shown in A. Current transitions with a dI/dt greater than a threshold value were excluded and mean levels were calculated so long as dI/dt remained below the threshold (Tyerman et al., 1992). Fitted to the data (dotted line) is the sum of 11 Gausian distributions with the same sd and using the mean current measured using nonstationary noise analysis (5.16 pA) but with variable n. C and D, Fast voltage ramps were used to obtain current as a function of voltage when channels were open and closed in 1 mm KCl (C, seven patches/ramps) or 10 mm KCl (D, four patches/ramps). The subtracted curves are shown as a function of voltage (dashed lines). Some ramps were from negative to positive voltage where the channel currents captured reversed at the same voltage as for positive to negative going ramps. Also shown are the currents obtained from nonstationary noise analysis (▪) with a cubic polynomial regression in A (solid line). Single-channel currents resolved for inward current in 10 mm KCl are also shown for one patch (●) with a fitted cubic polynomial. The external solution contained 1 mm CaCl2 and 5 MES, pH 6.0; pipette solution was type I. Data were either filtered at 1 kHz and sampled at 2 kHz or filtered at 2 kHz and sampled at 5 kHz.

