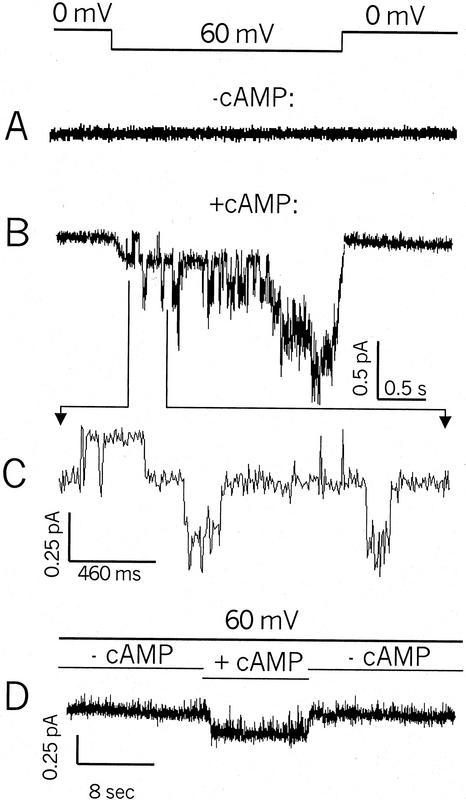
Figure 4.
K+ currents recorded (inside-out patch configuration) in the presence and absence of cAMP from membranes of oocytes expressing AtCNGC2. Currents shown in A and B are from the same patch. The bar at the top indicates the patch was held at 0 mV, and a 60-mV step voltage was applied as indicated for the recordings shown in A and B. Currents shown in A were obtained in the absence of cAMP, and the recording shown in B is from the same patch after perfusion with bath solution containing cAMP. The current tracing in C is a portion of the recording in B presented with an expanded scale. The current tracing in D is from a different patch, which was held at 60-mV command potential during the time course of the recording. The bars above the current trace indicate time periods when cAMP was absent, or applied to the bath solution.

