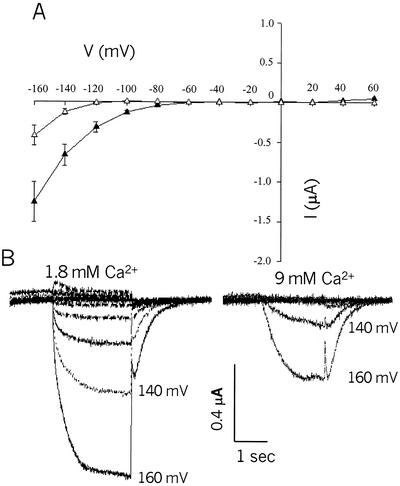
Figure 5.
Calcium inhibition of (leak-subtracted) K+ currents recorded in the two-electrode configuration from oocytes expressing AtCNGC2. Command voltages were applied in 20-mV steps between +60 and −160 mV. A, Leak-subtracted AtCNGC2 currents recorded from oocytes in the presence of 96 mm K+ and either the standard (1.8 mm) Ca2+ (black symbols) or high (9 mm) Ca2+ (white symbols) in the perfusion bath. Data are presented as means (n = 7 for 1.8 mm Ca2+; n = 6 for 9 mm Ca2+) ± se. B, Representative time-dependent AtCNGC2 currents recorded in the presence of high or low perfusion bath Ca2+.

