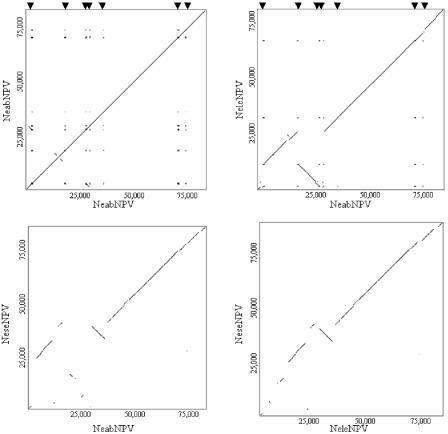
FIG. 3.
Genome parity plots. Genome plots were derived by comparing (A) NeabNPV against itself, (B) NeabNPV against NeleNPV, (C) NeabNPV against NeseNPV, and (D) NeleNPV against NeseNPV. The axes are labeled with the genome name and the distance (in base pairs). The interspersed repeat sites of NeabNPV are labeled on plots A and B. Triangles above plots A and B represent the locations of interspersed repeats 1 to 7.

