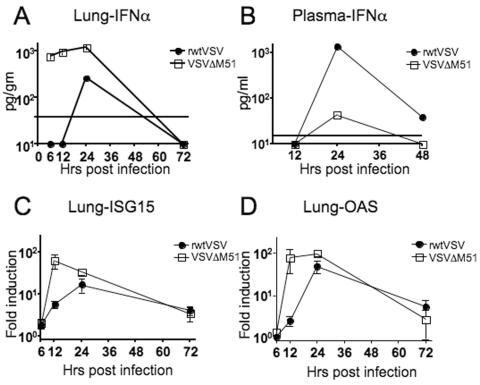
FIG. 4.
Induction of IFN-α- and IFN-α/β-inducible genes in rwtVSV- or VSVΔM51-infected mice. (A and B) IFN-α response, detected by ELISA, in lung supernatants (A) or plasma (B) at the designated times following i.n. infection of mice with rwtVSV or VSVΔM51. The solid horizontal line indicates the limit of sensitivity of the ELISA (A, 38 pg; B, 15.2 pg). Any numbers on the baseline indicate values below these limits of detection. Plasma and lung supernatant samples were pooled from six or four mice, respectively, at each time point. (C and D) Induction of ISG15 (C) or OAS (D) in mRNA from lungs, determined by real-time RT-PCR. ISG15 and OAS gene levels were normalized to GAPDH levels and are reported as increases (n-fold) in induction over levels for DMEM-administered controls. Error bars represent standard errors of the means (n = 4).

