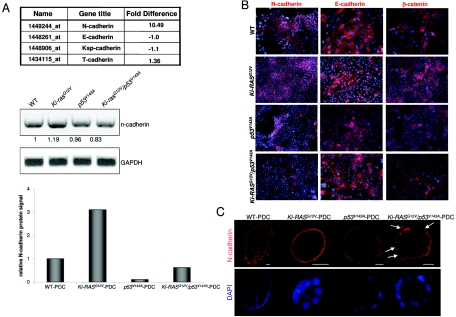
FIG. 7.
Differential expression of N-cadherin in WT-PDC, p53V143A-PDC, Ki-RASG12V-PDC, and Ki-RASG12V/p53V143A-PDC. (A) Gene microarray results showing cadherin expression levels in Ki-RASG12V-PDC versus WT-PDC. Quantitative analysis of N-cadherin and β-actin transcript levels by RT-PCR and protein levels by Western blotting were assessed in WT-PDC, p53V143A-PDC, Ki-RASG12V-PDC, and Ki-RASG12V/p53V143A-PDC. These analyses are representative of several experiments. Densitometry of N-cadherin mRNA and protein levels was performed using Scion Image Beta 4.02 software (Frederick, MD) and calibrated with the β-actin signal. The N-cadherin protein level of WT-PDC was set at 1.0. (B) Indirect immunofluorescence of N-cadherin (red), E-cadherin (red), and β-catenin (red) in PDC grown in a monolayer. Nuclei were counterstained with DAPI (blue). Magnification, ×400. (C) Indirect immunofluorescence of N-cadherin (red) and nuclei (blue) in PDC cysts grown in type I collagen. Arrows indicate partial loss of N-cadherin in Ki-RASG12V/p53V143A-PDC. Scale bar = 20 μm. Magnification, ×250.

