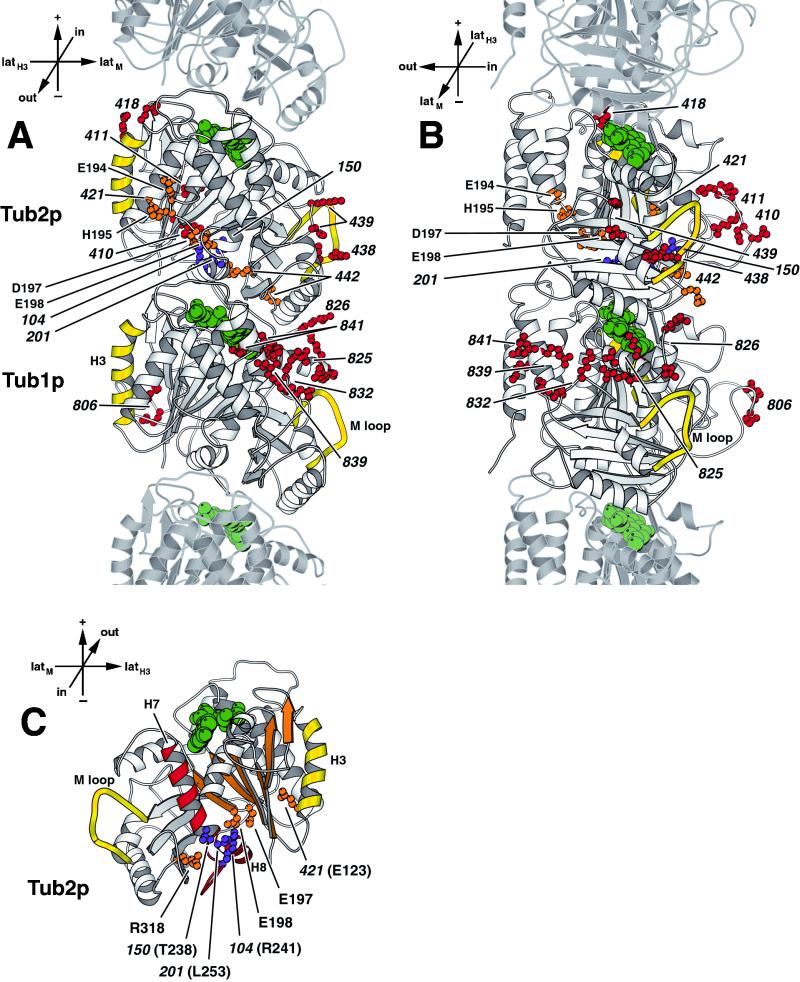
Figure 6.
Location of benomyl-resistant tub1 and tub2 alleles. (A) View from the outside of the microtubule. (B) View from the side of the protofilament. (C) Cutaway view of the core of β-tubulin, with the interior-facing loop (residues 24–62) removed, β-sheet S1–S6 is shown in orange, and the core helix H7, helix H8, and the intervening T7 loop are shown in red (Nogales et al., 1998b). The side chains of amino acids mutated in alleles resistant to only 40 μg/ml benomyl (red) and alleles resistant to at least 80 μg/ml benomyl (orange) are shown on Tub2p and Tub1p of the yeast tubulin heterodimer, labeled by their allele number. The amino acids mutated in tub2 alleles 431 (E194A, H195A, and E198A), 432 (E194A and D197A), and 433 (E198A) are individually labeled by their residue name and number. The amino acids mutated in tub2 alleles 201, 104, and 150 (Thomas et al., 1985; Machin et al., 1995) are shown in purple. Lateral interaction elements, α-helix H3 and M loop, are shown in yellow (Nogales et al., 1999). GTP and GDP are shown in green. Adjacent monomers of the protofilament are shown in lighter gray. Orientation axes: + and − show microtubule orientation; latH3 and latM show lateral sides marked by helix H3 α-helix and M loop, respectively; in and out represent the inside and the outside of the microtubule, respectively. Structure drawn using MOLSCRIPT (Kraulis, 1991).

