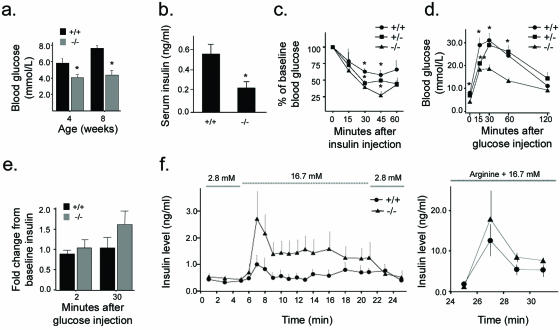
FIG. 4.
Glucose metabolism and insulin secretion. (a) Fasting blood glucose levels in RIPcre+ Ptenfl/fl mice are lower than those in littermate RIPcre+ Pten+/+ controls (n ≥ 8). *, P ≤ 0.005. (b) Systemic-fasting serum insulin levels are lower in RIPcre+ Ptenfl/fl mice (n ≥ 6). *, P ≤ 0.05. (c) Insulin tolerance tests demonstrate greater insulin sensitivity in RIPcre+ Ptenfl/fl mice. The hypoglycemic response to an i.p. injection of human regular insulin at a dose of 0.5 mU/g of body weight is expressed as a percentage of baseline blood glucose (n ≥ 3; age, 8 to 10 weeks). *, P < 0.05. (d) RIPcre+ Ptenfl/fl mice have lower glucose excursions after i.p. glucose tolerance tests compared with that for RIPcre+ Pten+/+ and RIPcre+ Pten+/fl mice (n ≥ 4; age, 2 to 4 months). *, P < 0.005 for comparison of RIPcre+ Ptenfl/fl versus RIPcre+ Pten+/+ or RIPcre+ Pten+/fl; **, P = 0.011 for RIPcre+ Pten+/fl versus RIPcre+ Pten+/+ and P = 0.042 for RIPcre+ Pten+/fl versus RIPcre+ Ptenfl/fl. (e) In vivo glucose-stimulated insulin secretion after i.p. glucose injection at 2 and 30 min is preserved. P was not significant. (f) Insulin secretion in isolated perfused pancreas. The left panel shows the response to glucose at the molar concentrations indicated. The right panel shows the response to arginine and 16.7 mM glucose. P was not significant for all time points. Error bars indicate standard errors of the means. +/+, RIPcre+ Pten+/+ mice; −/−, RIPcre+ Ptenfl/fl mice; +/−, RIPcre+ Pten+/fl mice.

