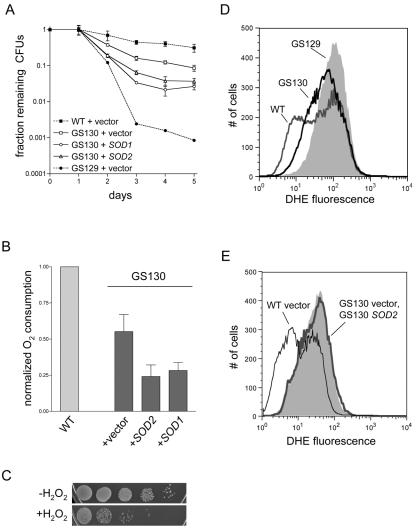
FIG. 7.
GS130 exhibits a less severe chronological life span defect than GS129 and is not rescued by overexpression of SOD. (A) Viability of the GS130 mutant plus either empty vector or plasmids that overexpress SOD1 or SOD2, determined as described in the legend to Fig. 4A. The wild-type (WT) and GS129 curves from Fig. 4A (which were carried out in parallel) are shown as dotted lines for comparison. (B) Stationary-phase oxygen consumption of the GS130 strains depicted in panel A. The wild-type result from Fig. 6A is shown for comparison and is given the arbitrary value of 1. (C) Serial 10-fold dilutions of a stationary-phase GS130 culture before (−H2O2) and after (+H2O2) treatment with 25 mM H2O2 for 2.5 h. (D) DHE fluorescence at day 2 of stationary phase of wild type (dark gray line), GS129 (light gray shading), and GS130 (black line). The median and mean fluorescence values, in relative fluorescence units, were the following: wild-type, 44.1 and 78.7; GS130, 59.3 and 89.3; GS129, 99.6 and 125. (E) DHE fluorescence at day 2 of stationary phase of GS130 containing either empty vector (light gray shading) or a plasmid carrying SOD2 (bold gray line), as described in the legend to Fig. 4C. For comparison, the profile of wild-type cells treated identically is overlaid as the thin black line.

