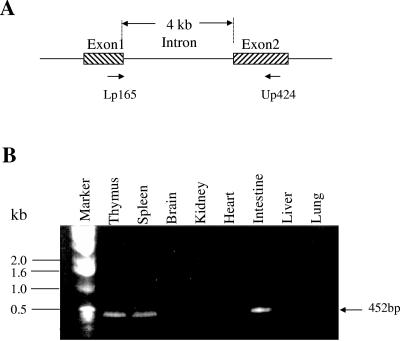
FIG. 3.
RT-PCR analysis of FAT10 expression from total RNA from various mouse tissues. A. Schematic representation of the locations of RT-PCR primers on the mouse FAT10 gene. Intron-spanning primers were designed to eliminate the formation of genomic amplicons. B. Gel electrophoresis analysis of various mouse tissues for FAT10 gene expression. The origins of tissues are indicated above the gel, and the positions of the DNA markers are indicated to the left of the gel.

