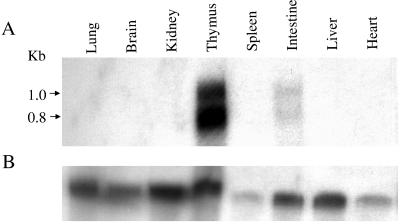
FIG. 4.
Northern blot analysis of FAT10 mRNA expression in different mouse tissues. A. The FAT10 mRNA expression pattern in different mouse tissues. The origins of tissues are indicated above the gel, and the positions of the kilobase markers are indicated to the left of the gel. B. GADPH probe hybridized to the same membrane as in panel A for RNA loading controls.

