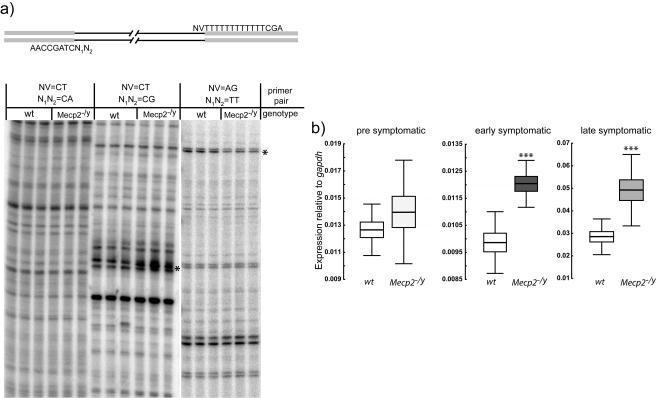
FIG. 1.
Global analysis of gene expression by ADDER reveals misexpressed genes in Mecp2-null mouse brain. (a) Top panel: primers used for differential display PCR. Shaded bars represent constant regions with 3′-terminal varied regions. Variable cDNA sequences are represented by lines. Bottom panel: differential display gels with two bands with altered intensity that were subsequently recovered and identified as Uqcrc1 (asterisk in center panel) and mt-Nd2 (asterisk in right panel). (b) Real-time PCR data showing Uqcrc1 up-regulation in early- and late-symptomatic mice but not in presymptomatic mice. Three pools, each containing RNA from three brains, were analyzed in quadruplicate to generate these data. The horizontal lines represent the means, the boxes delineate the standard errors of the means, and whiskers extend the standard deviations. ***, significant difference (t test, P < 0.001).

