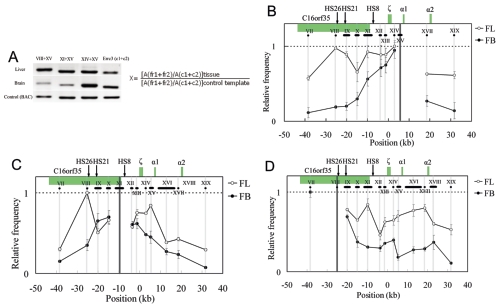
FIG. 3.
Spatial organization of the mouse α-globin locus. An example of PCR-amplified ligation products on 2% agarose gel and the equation used to calculate the ligation frequency of two given fragments, such as 1 and 2, are shown in panel A. Cross-linking patterns of the fragments XV close to the α1 gene (B), XI containing part of HS8 (C), and VIII containing HS26 (D) respectively, in fetal liver (unfilled circles) and brain (filled circles) are shown. The equation in panel A is used to calculate the relative ligation frequency (X). A(fr1+fr2): peak area (determined with UVI scan) of PCR signal obtained with two-test fragment ligation products. A(c1+c2): peak area of PCR signal obtained with two-Errc3 cut fragment (not linked) ligation products. A(fr1+fr2) and A(c1+c2) are determined for both tissues (fetal liver and brain) and the control sample (see Methods). In Fig. 3B to D, the highest relative ligation frequency value was set to 1, and then the relative values are plotted on the y axis for various test fragment sets. The horizontal black lines below the locus indicate the size and position of the analyzed RFs. The vertical gray lines show the central position of the analyzed RFs, and the black line represents the central position of the fixed RFs: XV (B), XI (C), and VIII (D). The x axis shows the distances relative to the ζ-globin mRNA cap site. Error bars represent the standard errors of the means.

