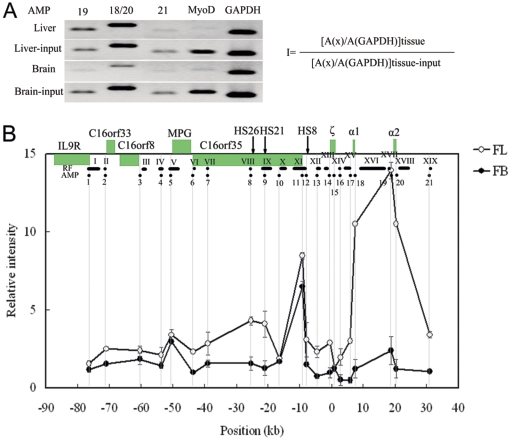
FIG. 5.
Occupancies of RNA Pol II at hypersensitive sites and gene promoters in the 130-kb chromatin region analyzed with ChIP assay. An example of PCR-amplified ChIP and input products on 2% agarose gel and the equation used to calculate the relative intensity of RNA Pol II at a given site are shown in panel A. The occupancy pattern of RNA Pol II across the 130-kb chromatin region is shown in panel B. The equation in panel A is used to calculate RNA Pol II intensity at a given site (I). A(x): peak area (determined with UVI scan) of PCR signal obtained with a certain site in the locus. A(GAPDH): peak area of PCR signal obtained with the GAPDH gene promoter. A(x) and A(GAPDH) are determined for both ChIP and input samples of two tissues. The relative intensity is plotted on the y axis for each test site using a scale relative to MyoD. The black dots below the locus indicate the analyzed amplicons (AMP) in ChIP. The gray vertical lines indicate the positions of the amplicons. The x axis shows the distances relative to the ζ-globin mRNA cap site. Error bars represent the standard errors of the means.

