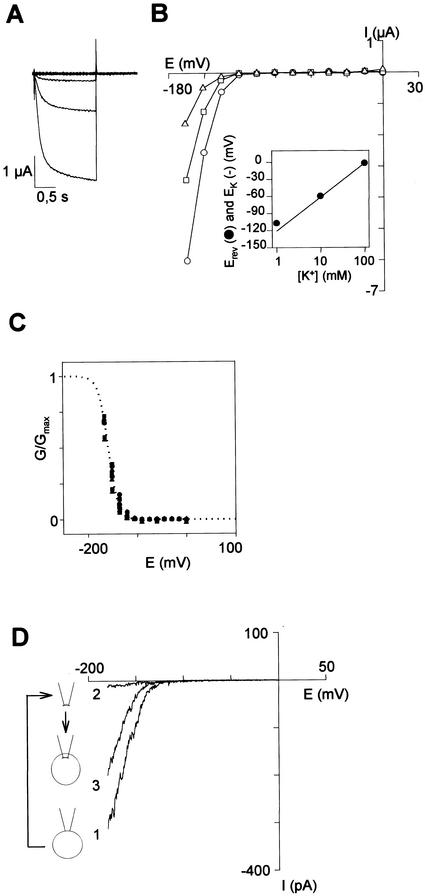
Figure 3.
SIRK is an inward-rectifying voltage-gated channel, as assessed by macroscopic current analysis in X. laevis oocytes. A through C, Analysis by two-electrode voltage-clamp. The bath solution contained 1 mm CaCl2, 1.5 mm MgCl2, 5 mm HEPES [4-(2-hydroxyethyl)-1-piperazineethanesulfonic acid]-NaOH (pH 7.4), and 100 mm (K + Na) Cl (K+ concentration indicated below). A, SIRK currents elicited by 1.5-s voltage pulses from 0 to −165 mV in 12 steps (−15-mV increments) from a holding potential of −40 mV in a 100 mm K+ solution. B, The steady-state current at the end of the activation step was plotted against membrane potential for three different external K+ concentrations (in mm): 100 (circles), 10 (squares), and 2 (triangles). Inset, Plotting the reversal potential (Erev) for the SIRK current (black circles) versus the external concentration of K+ revealed that Erev shifted by 56.5 mV for a 10-fold increase in external K+ concentration, as expected for a highly selective K+ channel. Solid line in the inset, K+ equilibrium potential (EK) calculated with the Nernst equation assuming a 113 mm intracellular K+ concentration (i.e. Erev = EK in 100 mm external K+). C, SIRK activation level at steady state for three different K concentrations (in mm): 100 (diamonds), 10 (squares), and 2 (triangles); n = 3 oocytes. A two-state Boltzmann relation (dotted line; Lacombe and Thibaud, 1998) modeled the G/Gmax ratio. D, Analysis of macroscopic cur- rents assessed by patch-clamp (patch-excision and patch-cramming). Both bath and pipette solutions contained 100 mm KCl, 2 mm MgCl2, and 10 mm HEPES-NaOH (pH 7.4). In the cell-attached patch clamp configuration, the current-voltage curve (1) is reminiscent of those obtained by two-electrode voltage-clamp (see B). After patch excision (inside-out configuration), the current amplitude decreased very quickly (trace 2, obtained 10 s after the patch excision). Patch cramming into the oocyte produced an increase in current (trace 3). Data shown are representative of five independent patch-cramming experiments.

