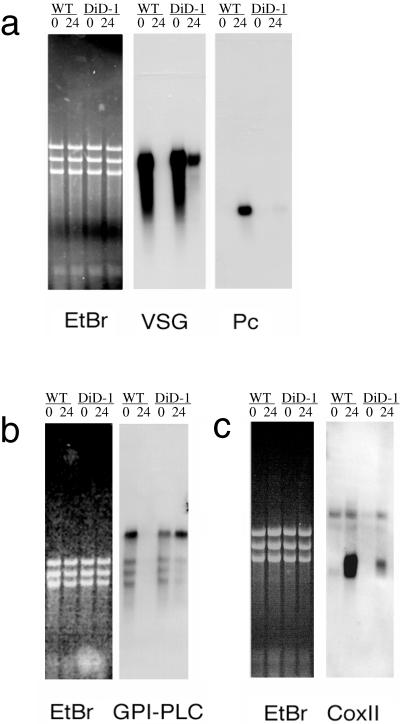
Figure 2.
Stage-regulated RNA expression in the DiD-1 and wild-type populations 24 h after incubation in culture at 27°C containing 6 mM cis-aconitate. To demonstrate relative loading, an ethidium-stained image of each gel is shown, together with its corresponding Northern blot. (a) VSG and procyclin gene expression; (b) GPI-PLC gene expression; (c) cytochrome oxidase subunit II gene expression. The respective sizes for each transcript are VSG, ∼1.6 kb; procyclin, ∼0.8 kb; GPI-PLC, ∼4 kb, and coxII, 0.7 kb.

