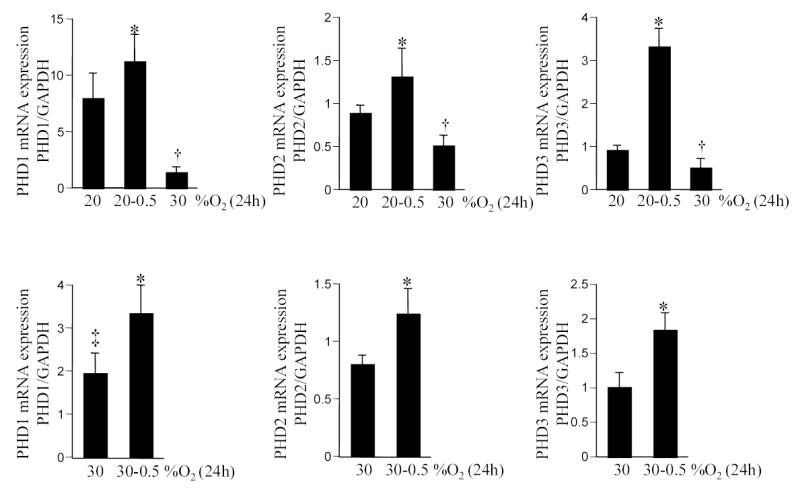
Figure 4. Expression of prolyl hydroxylase (PHD) 1–3 in response to changes in O2 ambience.

Cells were maintained in 20% (upper row) or 30% (lower row) O2 ambience for 4 weeks. For experiments, cells were plated and maintained in the corresponding O2 ambience for 24h. After that period, cells were moved to either a lower (0.5%) or higher (30%) O2 ambience as indicated. PHD mRNA levels were quantitated by real-time PCR. *or †, p<0.05 compared to the corresponding bar on the extreme left of each panel. ‡, lower compared to PHD1 expression in cells adjusted to growing in 20% O2 ambience (i.e. bar vertically above). Results are mean ± S.D.
