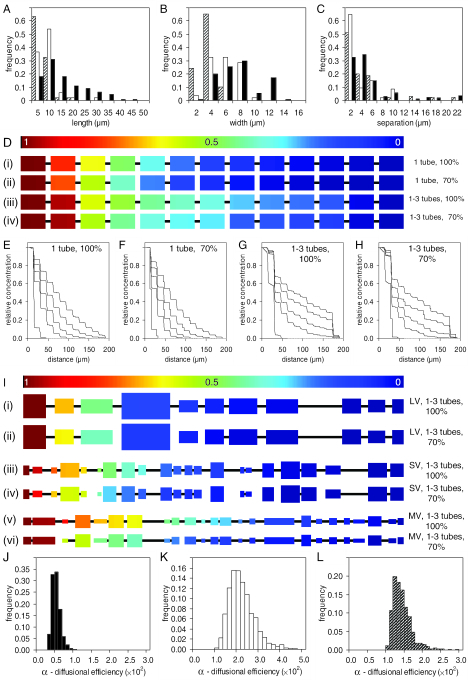
FIG. 6.
Construction of a geometric diffusion model for longitudinal transport through discrete vacuoles. The frequency distributions for vacuole length (A), width (B), and separation (C) were measured from confocal images of hyphae with mixed tubular and vesicular vacuole organization (hatched bars, MV [n = 49]; open bars, SV [n = 52]; solid bars, LV [n = 110]). (D) Simulation of solute diffusion in regular 205-μm-long vacuole strings consisting of 13- by 6.5-μm vacuoles connected by 0.44-μm tubes for 500 s with Dirichlet boundaries of C = 1 (red) and C = 0 (blue) at the left- and right-hand ends, respectively. Vacuole pairs were connected by either one tube continuously (row i), one tube connected intermittently (row ii), one to three randomly assigned tubes present continuously (row iii), or one to three tubes randomly assigned and connected intermittently (row iv). Intermittent connections constituted 70% of the connections, on average, over time. (E to H) Distribution of solute for four cases described in panel D after 7.5, 62, 124, 248, and 500 s. (I) Representative strings of vacuoles assembled by random selection with replacement from the distributions shown in panels A to C and simulated under the same initial and boundary conditions as shown in panel D for LV (rows i and ii), SV (rows iii and iv), and MV (rows v and vi) systems. The first string in each pair is connected continuously, while the second is randomly disconnected/connected such that vacuoles remain connected 70% of the time (see Video S6I in the supplemental material). (J to L) Monte Carlo simulations of 400-μm strings like those shown in panel I were used to generate the diffusional efficiencies (α [see text]) for LV (J), SV (K), and MV (L) systems.

