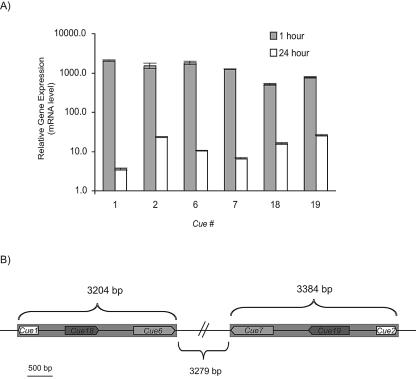
FIG. 1.
Cue genes located within an inverted repeat on genomic scaffold 73. (A) Gene induction after 1 and 24 h of copper exposure monitored by measuring mRNA levels with RT-PCR. mRNA concentrations are means normalized to control cells that were not treated with Cu. Error bars indicate standard deviations from two technical RT-PCR replicates. Note that the y axis is a logarithmic scale. (B) Schematic diagram of the inverted repeat region, indicated by gray bars. Cue gene designations and orientations are shown. The figure is shown to scale except for the intervening region between the inverted repeats, which is indicated by a double bar.

