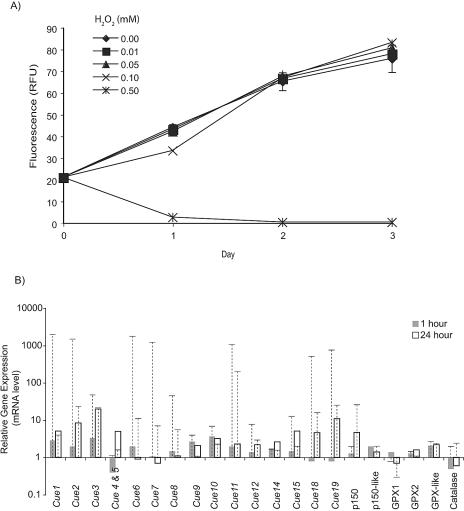
FIG. 4.
Effects of H2O2 exposure on T. pseudonana. (A) Growth of T. pseudonana exposed to various concentrations of H2O2. Cell growth was followed by measurement of chlorophyll fluorescence, and results are presented in relative fluorescence units (RFU). Results shown are of a representative growth experiment. Cells grown in batch culture were aliquoted into different treatment conditions on day 0. Error bars represent standard deviations for replicate cultures and are contained within the corresponding symbol when not visible. (B) Gene expression changes monitored by measuring mRNA levels with RT-PCR after 1 and 24 h of exposure to 0.1 mM H2O2. mRNA concentrations were normalized to control cells and are expressed in relative units. Note that the y axis is a logarithmic scale. mRNA levels from copper-exposed cells are also presented for comparison and are represented as dashed lines and bars.

