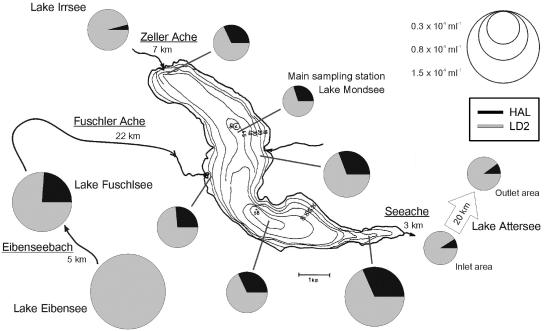
FIG. 5.
Abundance and composition of the SOL cluster community in Lake Mondsee and neighboring lakes on 3 and 4 September 2003. All samples were taken at a depth of 1 m. Sampling positions of Lake Mondsee are marked with gray lines. The names of sampled lakes and rivers connecting the lakes (underlined names with distances specified) are given. Arrowheads mark the directions of river flows. The sizes of the pie charts correspond to the total number of SOL bacteria. The scale bar (1 km) is only valid for Lake Mondsee. Sampling sites of Lake Attersee were 20 km apart.

