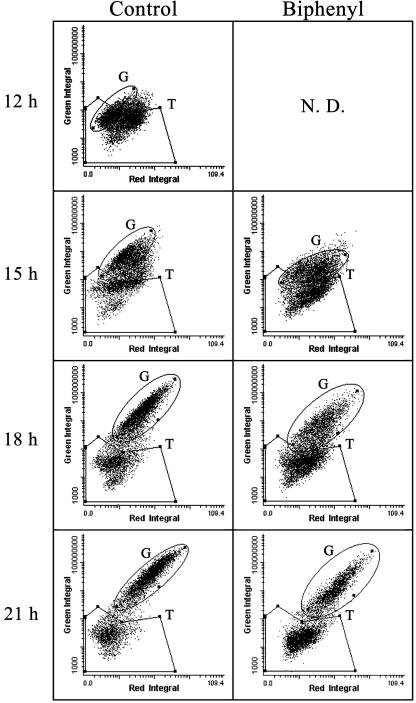
FIG. 3.
Scattergram of cytometric analysis from 12 to 21 h of incubation with or without biphenyl. Integrated values of fluorescence intensities from PI (x axes) and carboxy-DFFDA SE (y axes) were plotted. Two specified gates, gate T and gate G, are demarked areas and are described in Materials and Methods. The fluorescence of colonies incubated for 12 h with biphenyl could not be measured with an LSC because of the small size of the microcolonies and low intensity of fluorescence. N.D., not determined.

