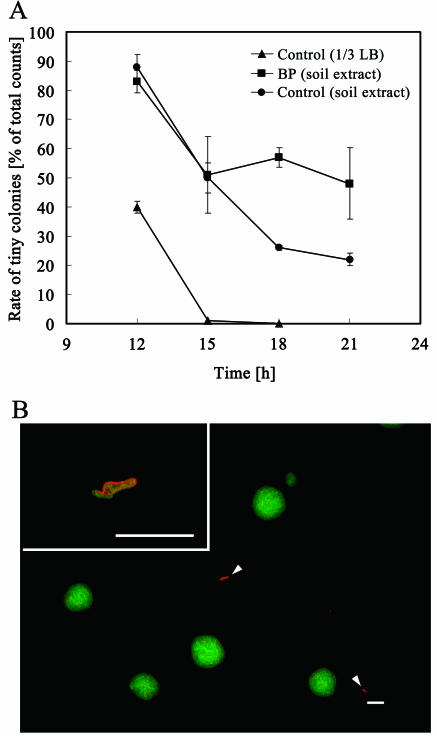
FIG. 4.
Formation of tiny colonies. (A) The percentage of tiny colonies was calculated from dot plots, with the number of events in gated area T on Fig. 3 divided by the total events. Filters were incubated on solid agar containing soil extract with (▪) or without (•) biphenyl (BP) and 1/3-diluted LB (▴). Error bars represent standard deviations. (B) CCD image of typical growth-arrested colonies (highlighted by arrowheads and enlarged in inset). The colonies were cultivated on a soil extract plate for 21 h. Bar, 50 μm.

