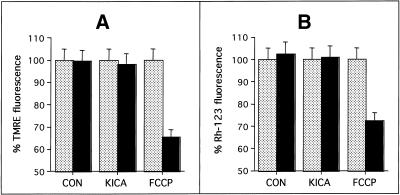
Figure 9.
Effect of KICA on mitochondrial membrane potential in cerebellar granule neurons. Cells were grown on coverslips and loaded with 200 nM TMRE (90 min) (A) or 1.3 μM Rh-123 (15 min) (B) and imaged 5 s before (gray bars) and 5 s after (black bars) addition of solvent (CON), 50 mM KICA, or 200 μM FCCP. In each case FCCP was added 8 min after KICA treatment. The results are expressed as percent fluorescence (measured at the appropriate emission λ for each dye) at the start of the experiment and represent the mean ± SEM from 50 individually imaged cells.

