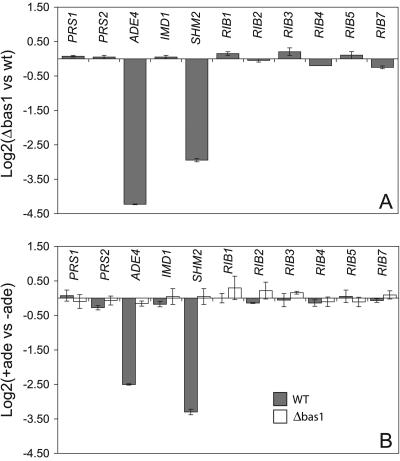
FIG. 5.
Comparison of the steady-state transcription levels of purine and riboflavin genes in wild-type and Δbas1 strains. (A) Differences in the transcription levels of the genes included in the assays between wild-type and Δbas1 strains grown in MA2 rich medium. (B) Relative transcription levels of the indicated genes measured in the wild-type (gray bars) and Δbas1 (white bars) strains grown in MA2 rich medium with (+ade) or without (−ade) an excess of adenine (0.1 g/liter). Transcription levels are normalized to the level of AgACT1 mRNA. The ratio of relative transcription of the target gene in panel A was calculated as 2−ΔΔCt, where ΔΔCt = ΔCtΔbas1 − ΔCtwild type. The ratio of the relative transcription of the target gene in panel B was calculated as 2−ΔΔCt, where ΔΔCt = ΔCtMA2 + ade − ΔCtMA2 − ade. An average of three separate cDNA dilutions from each target gene were obtained, and the relative transcription levels were expressed as log2 ± SD. vs, versus; WT, wild type.

