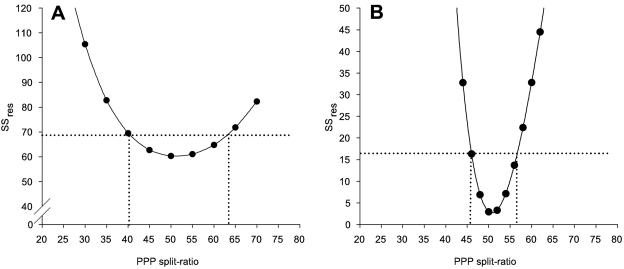
FIG. 7.
Sensitivity analysis of PPP split ratio determination for the 13C-based MFA method (A) and the gluconate tracer method (B). The horizontal dotted lines indicate the 95% cutoff values for SSres, as calculated with equation 5. The vertical dotted lines indicate the upper and lower boundaries for the 95% confidence intervals of the PPP split ratios.

