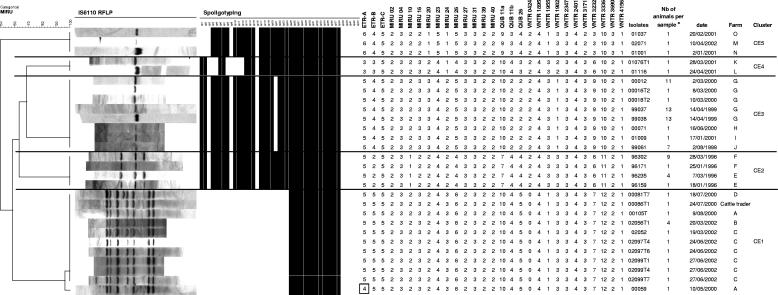
FIG. 2.
IS6110 RFLP, spoligotyping, and MIRU-VNTR patterns of isolates obtained from animals from different farms included in five distinct clusters with defined epidemiological links. The dendrogram at the left is based on MIRU-VNTR profiles and was built by using the UPGMA algorithm, as described in Materials and Methods. The single repeat change in locus ETR-A of sample 00059 compared to the same locus of the other isolates of cluster CE1 is boxed. a, a number (Nb) of >1 indicates a sample obtained by pooling tissues of n different animals from the same herd before mycobacteriological culture. See text and Fig. 3 for descriptions of farms and clusters.

