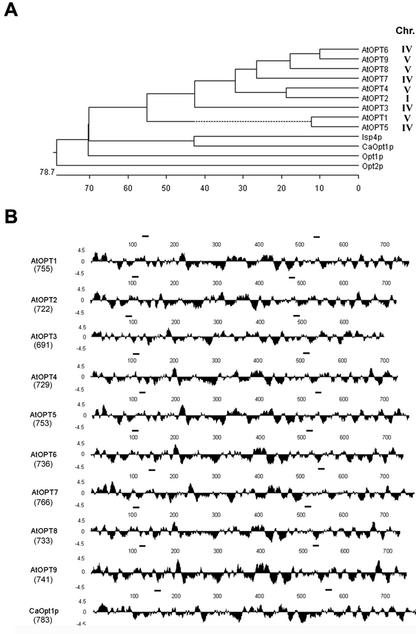
Figure 1.
Comparison of OPTs. A, Dendogram showing a sequence comparison of the known members of the OPT family. Analysis was performed using the CLUSTAL method in MegAlign (DNASTAR, Madison, WI) using default parameters. Accession numbers are as follows: AtOPT1, AB026659 GI:9758213; AtOPT2, AAB60748 GI:2160185; AtOPT3, Z97341 GI:2244994; AtOPT4, AB008268 GI:9759417; AtOPT5, AL078465 GI:4938497; AtOPT6, AL035602.1 GI:4469024; AtOPT7, AF080119 GI:3600039; AtOPT8, BAB09728.1 GI:9759191; AtOPT9, AB015476 GI:9759190; Opt1p, Z49487; CaOpt1p, U60973; Isp4p, P40900; Opt2p, U25841. The mapped positions of each AtOPT are indicated. B, Hydrophilicity plots of AtOPT1–9 and CaOpt1p as predicted by Kyte and Doolittle (1982). The size (amino acids) of the each protein is shown below the name of the gene. Analysis was performed using Protean (DNASTAR) under default parameters. The bars over each sequence show the location of the two conserved motifs (NPG and KIPPR motifs) (i.e. NPG[P/A]F[N/T/S]XKEH[V/T/A][L/I/V][I/V]I[T/S/V][I/V/M] [F/M][A/S][N/S/A] and K[L/F][G/A][H/M/T]YMK[I/V/L][P/D/S]PR).

