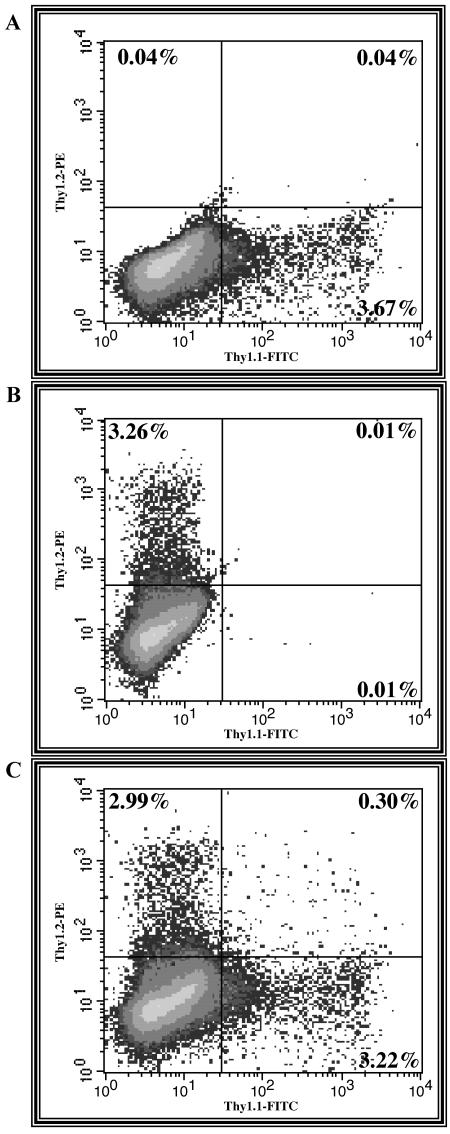
FIG. 2.
Density plots of infected cells. PM1 cells were coinfected with K103N-AT1 and wild-type AT2 viruses. Cells were stained at day 6 with either FITC-Thy1.1 antibody alone (A), PE-Thy1.2 antibody alone (B), or both antibodies (C). The log fluorescence intensities of FL1-H (FITC-Thy1.1) and FL2-H (PE-Thy1.2) are shown on the x axis and y axis, respectively. The horizontal and vertical lines represent gates that define positivity. The number of cells infected with K103N virus, wild-type virus, and both viruses is shown as a percentage in the upper left, lower right, and upper right quadrants, respectively.

