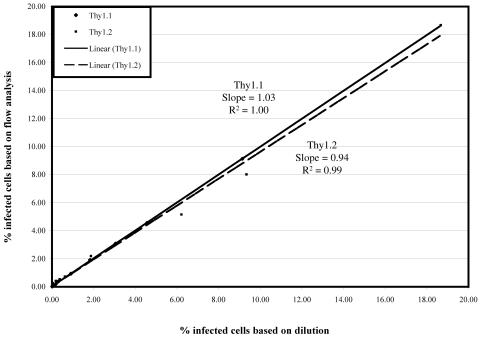
FIG. 3.
Linearity of flow staining. PM1 cells were singly infected with Thy1.1- or Thy1.2-expressing wild-type virus. Cells from the Thy1.1-infected culture were counted and diluted with cells from the Thy1.2-infected culture, and the reciprocal was done for the Thy1.2-infected culture. The following dilutions of cells were then stained with either the Thy1.1 or the Thy1.2 antibodies: undiluted, 1:2, 1:3, 1:5, 1:10, 1:30, 1:50, 1:100, 1:500, and 1:1,000. The x axis represents the percentage of infected cells based on dilution. For the Thy1.1 data, this number was obtained by taking the percentage of Thy1.1-positive cells from the undiluted sample as measured by flow and dividing it by each dilution. The same was done for the Thy1.2 data. The y axis represents the percentage of infected cells as measured by flow cytometry. ⧫, Cells infected with wild-type Thy1.1; ▪, cells infected with wild-type Thy1.2. The solid and dotted lines represent the best-fit linear curves for Thy1.1 and Thy1.2, respectively. The slopes and R2 values are shown next to each curve.

