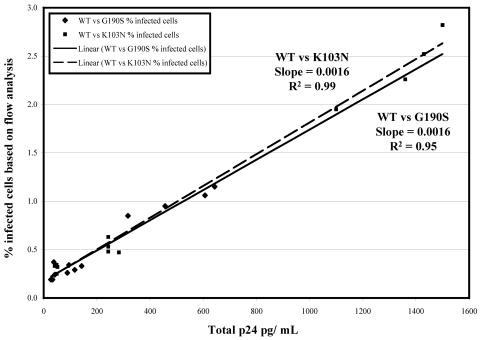
FIG. 4.
Correlation of p24 quantitation with flow analysis. Seven million PM1 cells were coinfected with the following combinations of virus: wild-type AT1/G190S-AT2, wild-type AT2/G190S-AT1, wild-type AT1/K103N-AT2, and wild-type AT2/K103N-AT1. A total of 300 ng of p24 was used at either equal ratios or ratios favoring the mutant. On days 3, 4, 5, and 6 cells were removed from the culture for staining, and supernatant was removed for p24 antigen quantitation. The x axis represents the p24 concentration in pg/ml. The y axis represents the percentage of infected cells obtained by flow analysis. The data from both Thy alleles were combined into one plot for each mutant competition. ⧫, G190S versus wild-type competitions; ▪, K103N versus wild-type competitions. The solid and dotted lines represent the best-fit linear curve for the G190S and K103N competitions, respectively.

