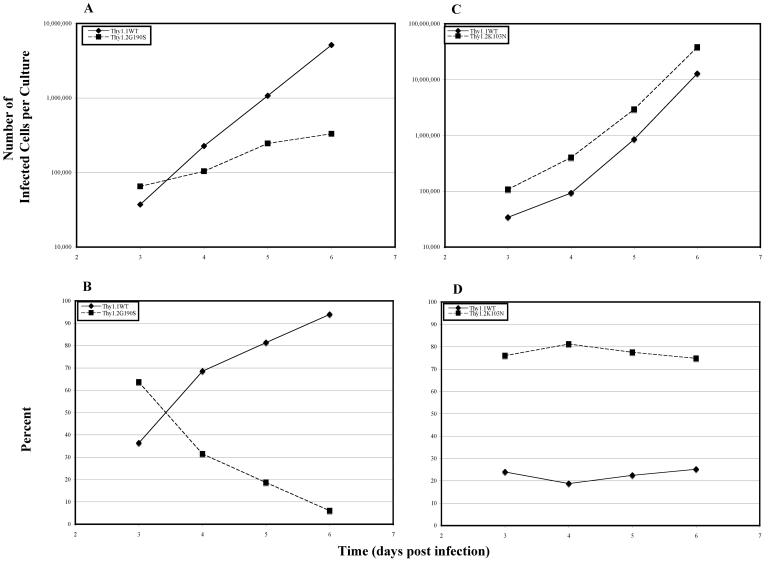
FIG. 6.
Competition of G190S and K103N versus wild type. Seven million PM1 cells were coinfected with wild-type AT2 and G190S-AT1 or wild-type AT2 and K103N-AT1. A total of 300 ng of p24 was used at a ratio of 225 ng (75%) of mutant to 75 ng (25%) of wild type (WT). The x axis represents time in days. The y axis represents either the percentage of infected cells on a logarithmic scale for G190S versus the wild type (A) and K103N versus the wild type (C) or the proportions of mutant and wild type for G190S versus the wild type (B) and K103N versus the wild type (D). The dotted line represents the mutant, and the solid line represents the wild type. The proportion of each genotype was calculated by dividing the percent infected cells or the number of infected cells determined for each virus and dividing it by the sum of the percent infected cells or the number of infected cells for both viruses.

