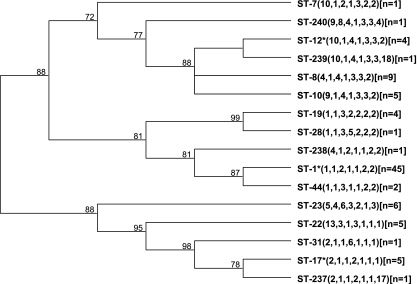
FIG. 1.
UPGMA dendrogram showing the genetic relationship between the 16 STs. The allelic profile of each ST is shown in parentheses next to the ST designation. The number of isolates found in each ST is shown in brackets. BURST analysis identified four clonal group complexes: group 1 had STs 8, 10, 12, and 239; group 2 had STs 19 and 28; group 3 had STs 1, 44, and 238; and group 4 had STs 17, 31, and 237. The ancestral genotype of the three groups (12, 1, and 17) is denoted by an asterisk. The numbers at the nodes represent the percentage of times each node was represented in the bootstrap analysis.

