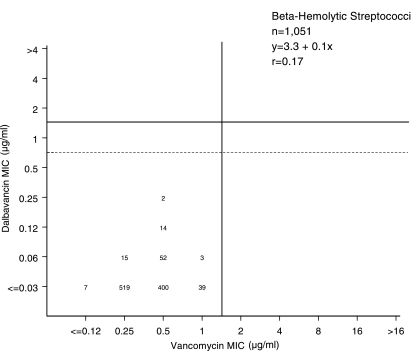
FIG. 2.
Scattergram plot comparing the dalbavancin and vancomycin MIC results for 1,051 β-hemolytic streptococcus isolates tested by the broth microdilution method (4). The single vertical line shows the susceptible-only breakpoint for vancomycin (≤1 μg/ml). Solid and broken horizontal lines show potential dalbavancin breakpoints of ≤1 and ≤0.5 μg/ml, respectively.

